Climate change, population and climate has been putting much pressure in water sustainability for crop production, energy generation, domestic supply. These are caused by water shortage in times of low rainfall months and prolonged droughts and dry seasons. On the other hand, intense and extreme rainy seasons have brought flooding which has taken toll on socio-economic growth in the Philippines and many tropical parts of the world. The Philippines is known to have abundant rainfall in terms of the annual amount of about 2000 mm to almost 4000 mm depending on location from which surface water resources such as streamflow, runoff and including recharge are derived. Despite abundance in annual scale, rainfall variability in monthly and daily scales remains to bring drought and flood at least once over a year. These phenomena are normal in more than half of the country having pronounced dry and wet months. However, it is aggravated by the degree of degradation of landscapes because of uncontrolled human activities such as the rapid conversion of natural landcover for urbanization, industrialization, and cultivation of even hilly areas for crop production. Watershed degradation threatens to cause more flooding, landslide, liquefaction, and drought. Moreover, these phenomena are exacerbated by climate change, which is projected to cause an increase in temperature with more rains during wet seasons and fewer rains during dry seasons. The Philippines is the 4th most vulnerable country to natural calamities based on 1995-2015 data. Moreover, it ranked 3rd in terms of the level of disaster risks (World Risk Report, 2016). The current trend shows that severe drought occurs in the country every 4 to 5 years, which would mean more potential damages to crop production. Balderama et al. (2016) projected corn yield to decline by as much as 44% in 2020 and 35% in 2050 due to temperature and rainfall erratic changes. Also, Lansigan et al. (2000) concluded that 65, 81 and 52% decline in rice yield were experienced in the Philippines due to the strong El Niño events 1973, 1983, and 1990, respectively. Furthermore, trend analyses of rice yield showed declines for every 1⁰C increase in seasonal mean temperature by 15% from 1979 to 2003 (Peng et al., 2004) and by 13.7% from 1970 – 2005 in the rainfed areas in the country (Roberts, Dawe, Falcon, & Naylor, 2009). Huge economic losses due to climate change and disasters have been accounted for by the Department of Agriculture to reach PHP163.6 billion in agriculture from 2011 to 2015. A single event of prolonged drought due to El Niño in 2010 has resulted in 12 billion pesos (US$235million, 1Php = US$54) of economic loss in agriculture which adversely affected the livelihood of many smallholder farmers. The Department of Agriculture Region 2 reported 46.9 billion damages from 2013 to 2020 due to droughts and moisture stress in corn production areas alone. That is equivalent to about 6 billion annual loss in corn production due to moisture stress brought by dry spell. On the other hand, waterless communities
are the most vulnerable during droughts with no to little drinkable water. About 92.8% of population in Region 2 have access to safe water leaving about 7.2% or around 24,000 people with poor access to safe water (National Economic development Authority & Department of Interior and Local Government, 2013).
Currently, the country is experiencing La Niña which is projected to last until the first quarter of 2021. This brought strong and successive typhoons in the recent months which brought massive flooding in the Cagayan Valley region. The wrath of the Typhoon Ulysses caused at least 27 fatalities in the Region and at least 10 billion pesos economic losses in the country. Cagayan Valley had the most damages with ₱2.1 billion losses in Agriculture and ₱2.3 billion in infrastructure (CNN Philippines, 2020). These are just few of the many socio-economic losses that have been disrupting the region’s and country’s agricultural and economic growth. On average, El Niño and La Niña events occur every two to seven years. El Niño usually happens more often than La Niña (National Oceanic and Atmospheric Administration, n.d.). Typically, El Niño occurs after La Niña. It has been shown that climate change increases the frequency and magnitude of the El Niño Southern Oscillation phenomena (Cai et al., 2014; Lou et al., 2019; Villafuerte, Matsumoto, & Kubota, 2015). It is therefore important that the Region prepares for the next occurrence of drought to reduce the recurrent huge impacts of the El Nino phenomenon.
The use of ICT tools for decision support system has been recognized by the present administration as specified in its medium-term plan. It will help address wide range of water security issues especially in reducing the impacts of climate extremes, landuse change and urbanization through science-based interventions. Integration of climate, hydrological and flood models would constitute a decision support system that will help authorities to have better preparation plans an action in times of possible flood and drought events. Surface water and groundwater models integrated with water demand models would help quantify water resources comprehensively. Water resources assessments have the potential to monitor the plans and policies that are taken to ensure water enhancement. Therefore, developing a framework for water security assessment at a basin level that would subsequently inform decision making on sustainable water resources management. Hence, there is much interest for the need to comprehensively assess water resources in the service areas considering socio-economic factors, increasing demands from other sectors, expansion of irrigation services and the effect of climate change.
Objectives
Overall, the project aims to develop a comprehensive water resources assessment framework as basis in designs and implementation of water related projects and interventions in Region 2 considering the impacts of climate change, landuse change, urbanization and population growth.
Specifically;
- To conduct, assessment, and analysis of water resources, uses and existing water infrastructure, policies and governance in the provinces of Region 2
- To develop localized tools or framework for water resources planning needed for future water development and management strategies per province
- To design and implement appropriate water management and interventions for adoption and actual demonstration
Outputs
Products
People services
Publicatins
Patents
Policies
Beneficiaries
- Cagayan River Basin Management Council
- Regional and Local Disaster Risk Reduction and Management Councils
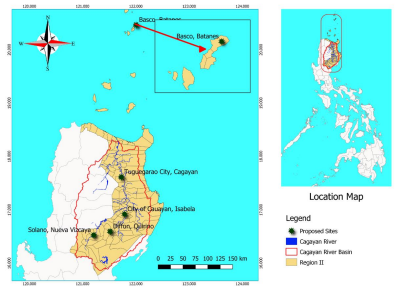
- Local Government Units – Solano, Nueva Viscaya; Cauayan City, Isabela; Basco, Batanes, Diffun, Quirino and Tuguegarao City, Cagayan and other LGUs in Region 2
- Relevant NGAs – NWRB, DENR, NIA, DILG, DA, Water districts
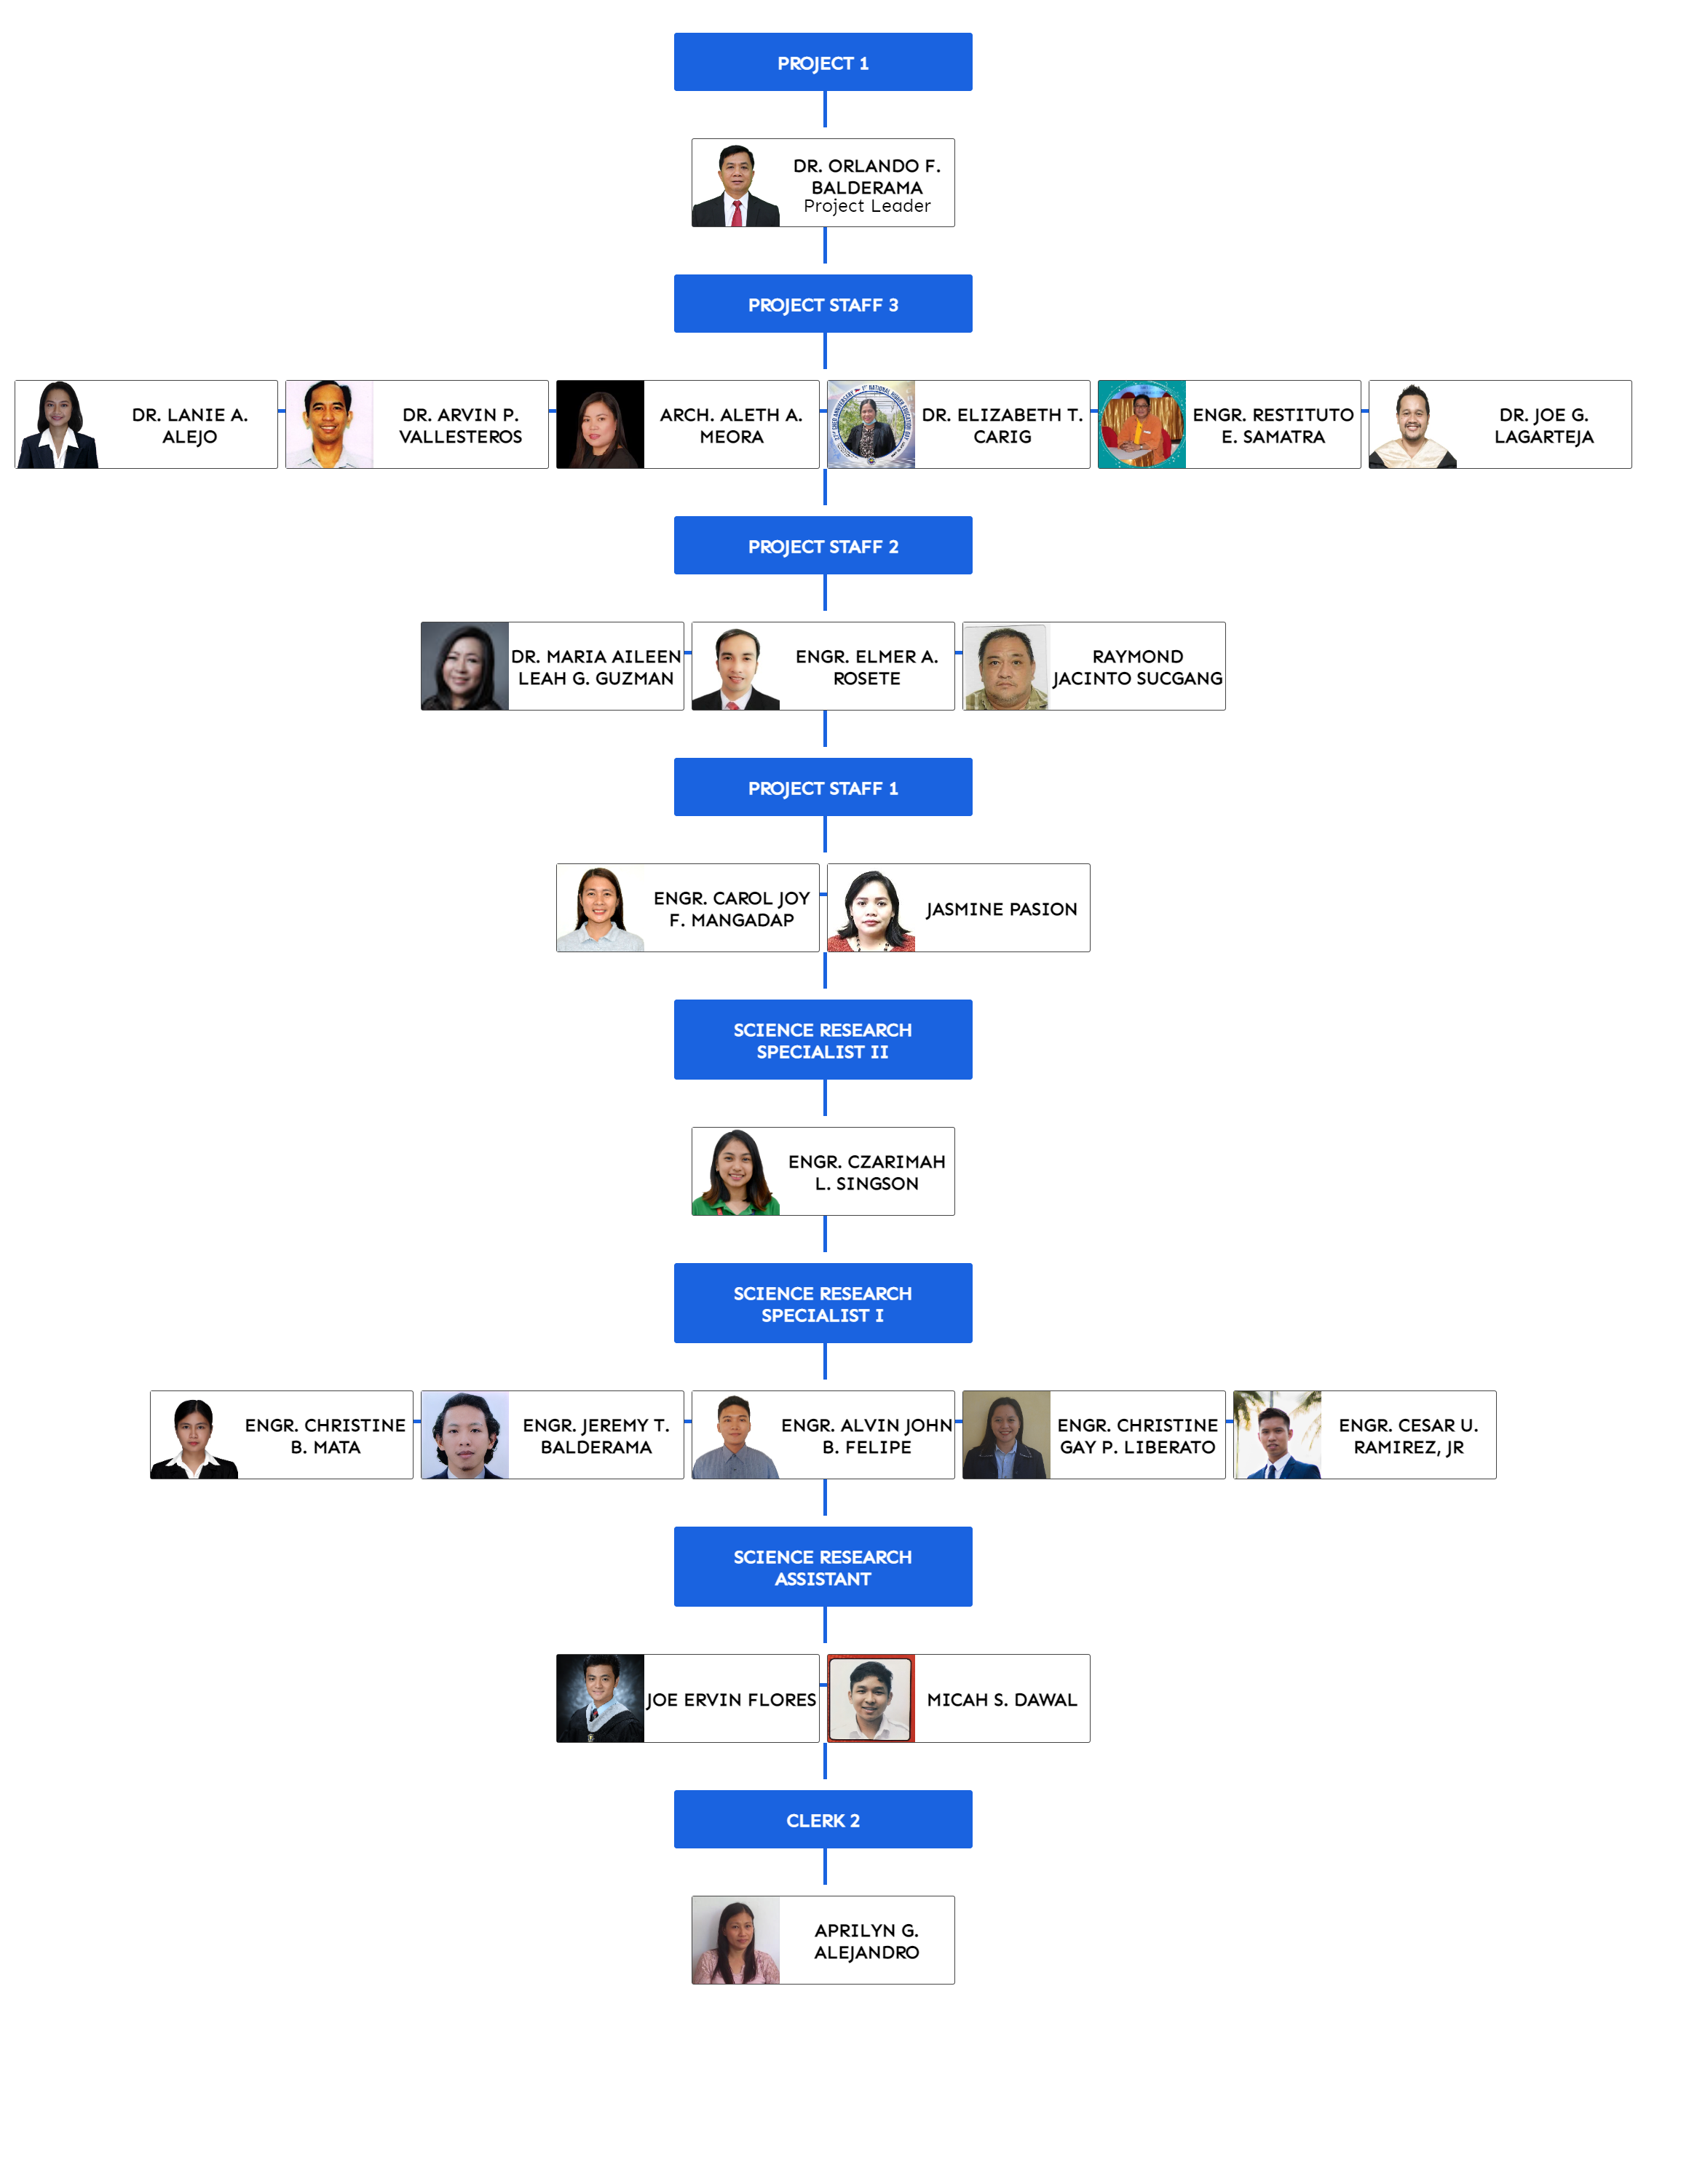
Organizational Chart